Metrics
Table of Contents
1. Metrics
1.1. confusion matrix
https://en.wikipedia.org/wiki/Confusion_matrix
P
positive, 即 ground truth 中的真值, 或者叫 real positive
N
negtive, ground truth 中的假值, 或者叫 real negative
T
true, 即预测为 true
F
false, 即预测为 false
TP
true positive. 预测为真 (true), ground truth 为真 (positive)
FP
false positive. 预测为真 (true), ground truth 为假 (negative)
TN
true negative, 预测为假 (false), ground truth 也为假 (negative)
FN
false negative, 预测为假 (false), ground 为值 (positive)
Precision
查准率
\(\frac{TP}{TP+FP}\) 或 \(\frac{TP}{T}\)
即 预测正确的正样本/预测的正样本
TPR
true positive rate, 或者叫 recall (召回率), 查全率.
\(\frac{TP}{TP+FN}\) 或 \(\frac{TP}{P}\)
即 预测正确的正样本/真正的正样本
FPR
false positive rate
表示 ground truth 中的 假值被预测错误 的比例
\(\frac{FP}{FP+TN}\) 或 \(\frac{FP}{N}\)
FNR
false negative rate
\(\frac{FN}{FN+TP}\) 或 \(\frac{FN}{P}\)
TNR
true negative rate
\(\frac{TN}{TN+FP}\) 或 \(\frac{TN}{N}\)
FRR
false reject rate, 即 FNR
FAR
false accept rate, 即 FPR
EER
equal error rate.
通过调整 threshold 使 FAR 与 FRR 相等, 这时的 FAR 或 FRR 称为 EER.
这个值与 ROC 曲线有点关系:
ROC 的 x 轴是 FPR, y 为 TPR. 由于 TPR = 1-FNR, 所以 fnr-fpr 曲线的形状会类似于 \(y=\frac{1}{x}\), 这个曲线与 \(y=x\) 的交点即为 EER
Accuracy
\(\frac{TP+TN}{P+N}\)
F-Score
F-Score 是 precision 和 recall 的调和平均
ROC
receiver operating characteristic
当选择不同的 threshold 时, 得到不同的 FPR 和 TPR. 以 FPR 为横轴, TPR 为纵轴绘制的曲线
这个曲线有如下的性质:
- x,y 坐标范围均为 [0~1]
- (0,0),(1,1) 必定在曲线上.
- 当 threshold 为 0 时, 所有预测值均为真, 导致 TPR 为 1, FPR 也为 1
- 当 threshold 为 1 时, 所有预测值均为假, 导致 TPR 为 0, FPR 也为 0
- 若完全随机的预测, 而 ROC 曲线 是一条连接 (0,0) 和 (1,1) 的真线
一个好的预测得到的 ROC 曲线应该在上面提供的直线的上方

完美的预测应该得到上图的 ROC 曲线: FPR 很低, 同时 TPR 很高, 即 ground truth 中的真值和假值都能测试正确
AUC
aera under the roc curve
ROC 曲线下面围成的面积, 范围应该是 [0.5, 1]
mAP
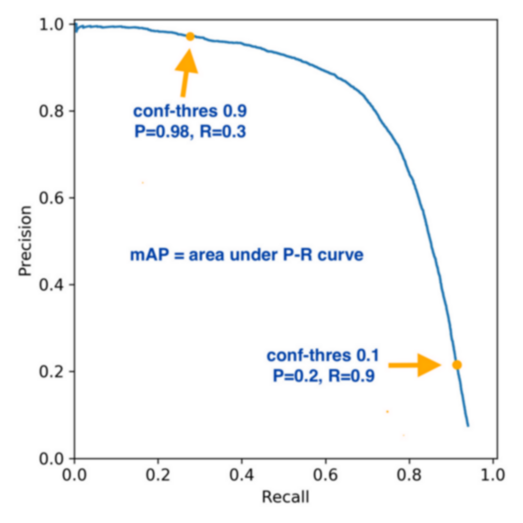
precison recall curve 是选择不同的 threshold 画出 precison 和 recall 的曲线. 大约是这样:

AP (average precision) 是指在 precison recall curve 上均匀的选 N 个不同的 recall, 计算其对应的 presision 的均值, 当 N 足够大时, 相当于 precision-recall 曲线的面积
mAP 是针对多个 class 的多个 AP 的均值.
AUC 和 ROC 反映 recall 和 false alarm 的关系, 而 AP 反映 recall 和 precision的关系
1.2. example
https://keras.io/api/metrics/classification_metrics/#truepositives-class
#!/usr/bin/env python3
import tensorflow as tf
import numpy as np
from sklearn.metrics import roc_curve, roc_auc_score
import matplotlib.pyplot as plt

y_true = np.array([0, 0, 1, 1])
y_pred = np.array([0, 0.5, 0.3, 0.9])

print("calc using sklearn")
fpr, tpr, thresholds = roc_curve(y_true, y_pred)
print(tpr, fpr, thresholds)
plt.plot(fpr, tpr)
plt.show()

print("calc using keras")
m = tf.keras.metrics.AUC(num_thresholds=3)
m.update_state(y_true, y_pred)
#
# num_thresholds 至少为 2, 对应的 threshold 为 [0,1]
# 当 num_thresholds 大于 2 时, threshold 为 [0, a,b,..., 1],  中间的 a,b,... 为
# 插值
#
# threshold values are [0, 0.5, 1]
# tp = [2, 1, 0], fp = [2, 0, 0], fn = [0, 1, 2], tn = [0, 2, 2]
# recall = [1, 0.5, 0], fp_rate = [1, 0, 0]
# auc = ((((1+0.5)/2)*(1-0))+ (((0.5+0)/2)*(0-0))) = 0.75
print("auc", m.result().numpy())
m = tf.keras.metrics.TruePositives([0, 0.5, 1])
m.update_state(y_true, y_pred)
print("tp", m.result().numpy())
m = tf.keras.metrics.FalseNegatives([0, 0.5, 1])
m.update_state(y_true, y_pred)
print("fn", m.result().numpy())

print("calc manually")
thresholds = np.array([0 - 1e-7, 0.5, 1 + 1e-7])
thresholds = np.broadcast_to(thresholds, (4, 3)).T

# tp,fp,fn,fn
tp = np.bitwise_and(y_true.astype(bool), y_pred > thresholds).sum(axis=1)
print("tp", tp)
fp = np.bitwise_and(~y_true.astype(bool), y_pred > thresholds).sum(axis=1)
tn = np.bitwise_and(~y_true.astype(bool), ~(y_pred > thresholds)).sum(axis=1)
fn = np.bitwise_and(y_true.astype(bool), ~(y_pred > thresholds)).sum(axis=1)
print("fn", fn)
# tpr,fpr
# tp+fn 即 ground truth 里有多少 true
# tpr 及 recall (查全率)
tpr = tp / (tp + fn)
# fp+tn 即 ground truth 有多少 false
fpr = fp / (fp + tn)
# precision,recall
precision = tp / (tp + fp)
recall = tpr
f_score = precision * recall / (2 * (precision + recall))

r = range(len(thresholds))
area = 0
for a, b in zip(r, r[1:]):
    area += (tpr[a] + tpr[b]) / 2 * (fpr[a] - fpr[b])

print(area)
plt.plot(fpr, tpr)
plt.show()
calc using keras auc 0.75 tp [2. 1. 0.] fn [0. 1. 2.] calc manually tp [2 1 0] fn [0 1 2] 0.75
1.3. multi-class metrics
上面提到的许多 metrics 例如 TP, FN 等都是针对 binary classification, 需要明确的 true/false 和 positive/negative.
如果是 multi-class 问题, 有两种方法有计算 metrics:
- 把 N-class 看成 N 个 binary 问题, 针对每一个 class 计算单独的 metrics
- 把 N-class 看成 N 个 binary 问题, 但是在计算时用某些方法来平均一下
例如:
import torch
from torchmetrics import F1Score


target = torch.tensor([0, 1, 2, 0, 1, 2])
preds = torch.tensor([0, 2, 1, 0, 0, 1])

print(F1Score(num_classes=3, average="none")(preds, target))
print(F1Score(num_classes=3, average="macro")(preds, target))
print(F1Score(num_classes=3, average="micro")(preds, target))
tensor([0.8000, 0.0000, 0.0000])
tensor(0.2667)
tensor(0.3333)
其中 `macro` 和 `micro` 使用的平均方法见参考 https://vitalflux.com/micro-average-macro-average-scoring-metrics-multi-class-classification-python/
即:
- macro 是针对各个 class 单独计算后求平均, 比较宏观 (macro)
- micro 是把 TP/FP 等累加后做为总的 TP/FP, 然后再依据 TP/FP 计算其它 metrics, 比较微观 (micro)
